node_exporter metrics
node_exporter has bazillion of metrics, most of then wont be used, so why collect them, did tried to go thrue all of them and make some notes
in my case I'm on single virtual machine with kafka, so no docker, kubernetes etc, good old plain virtual machine
actual version - https://github.com/prometheus/node_exporter/releases (looking for node_exporter-*.linux-amd64.tar.gz, at moment 1.3.1)
sudo wget -O /opt/node_exporter-1.3.1.linux-amd64.tar.gz https://github.com/prometheus/node_exporter/releases/download/v1.3.1/node_exporter-1.3.1.linux-amd64.tar.gz
sudo tar -xzf /opt/node_exporter-1.3.1.linux-amd64.tar.gz -C /opt
sudo rm /opt/node_exporter-1.3.1.linux-amd64.tar.gz
sudo ln -s /opt/node_exporter-1.3.1.linux-amd64 /opt/node_exporter
add it to path
sudo tee /etc/environment > /dev/null <<EOT
PATH="/usr/local/sbin:/usr/local/bin:/usr/sbin:/usr/bin:/sbin:/bin:/usr/games:/usr/local/games:/snap/bin:/opt/node_exporter"
EOT
source /etc/environment
from now we can simply run node_exporter and open http://localhost:9100/metrics
to see available options run node_exporter --help
to run as a service:
sudo tee /etc/systemd/system/node_exporter.service > /dev/null <<EOT
[Unit]
After=network.target

[Service]
Type=simple
User=root
ExecStart=/opt/node_exporter/node_exporter --collector.disable-defaults --web.max-requests=10 --web.disable-exporter-metrics

[Install]
WantedBy=multi-user.target
EOT
notes:
- it should not be ran as root user, but for sacke of simplicity it leaved as is
- if no commandline arguments passed all default collectors enabled, to run it without everything use
--collector.disable-defaults --web.disable-exporter-metrics
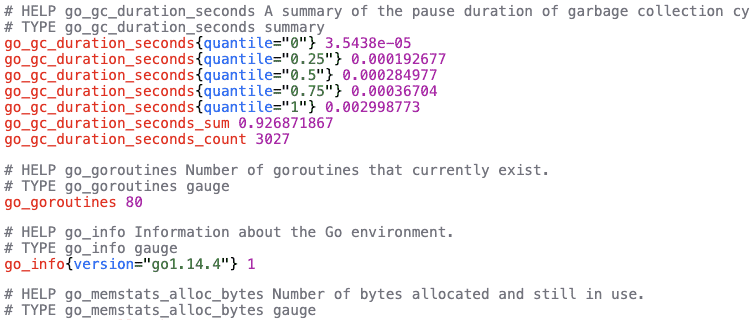
chrome prometheus formatter extension
for easier discovery of what available there is prometheus formatter chrome extension which will colorize endpoint output
sources can be found here
collector.cpu
in most tutorials used to calculate cpu usage percentage
--collector.cpunode_cpu_seconds_total{cpu="0",mode="idle"} 418594.7
node_cpu_seconds_total{cpu="0",mode="iowait"} 569.35
node_cpu_seconds_total{cpu="0",mode="irq"} 0
node_cpu_seconds_total{cpu="0",mode="nice"} 10.64
node_cpu_seconds_total{cpu="0",mode="softirq"} 892.53
node_cpu_seconds_total{cpu="0",mode="steal"} 0
node_cpu_seconds_total{cpu="0",mode="system"} 4018.45
node_cpu_seconds_total{cpu="0",mode="user"} 11230.68collector.filesystem
watch for disk space
--collector.filesystem
--path.rootfs="/"
--path.sysfs="/sys"
--path.procfs="/proc"
--collector.filesystem.fs-types-exclude="^(autofs|binfmt_misc|bpf|cgroup2?|configfs|debugfs|devpts|devtmpfs|fusectl|hugetlbfs|iso9660|mqueue|nsfs|overlay|proc|procfs|pstore|rpc_pipefs|securityfs|selinuxfs|squashfs|sysfs|tracefs)$"
node_filesystem_avail_bytes{device="/dev/sda1",fstype="ext4",mountpoint="/"} 7.015657472e+09
node_filesystem_size_bytes{device="/dev/sda1",fstype="ext4",mountpoint="/"} 1.0222829568e+10collector.diskstats
unfortunatelly there is no queue metrics, but still we can watch for current io operations or measure reads vs writes count, bytes, time
--collector.diskstats
--collector.diskstats.ignored-devices="^(ram|loop|fd|(h|s|v|xv)d[a-z]|nvme\\d+n\\d+p)\\d+$"
node_disk_io_now{device="sda"} 0collector.filefd
technically if file descriptors will be bigger than maximum system will die, but not sure how big app should be
--collector.filefdnode_filefd_allocated 2656
node_filefd_maximum 9.223372036854776e+18collector.loadavg
cpu usage
--collector.loadavgnode_load1 0.06
node_load5 0.03
node_load15 0collector.logind
technically can be used to watch for ssh sessions, e.g. imagine that you are paranoic and want alert if there is ssh connection being established
--collector.logindnode_logind_sessions{class="user",remote="true",seat="",type="tty"} 2collector.meminfo
all memory related stuff, at least to watch for memory not to become bottleneck
--collector.meminfonode_memory_MemFree_bytes 1.54710016e+08
node_memory_MemTotal_bytes 3.108298752e+09
collector.netdev
can be used to watch for incomming and ongoing traffic
--collector.netdev
--collector.netdev.device-include=ens160
node_network_receive_bytes_total{device="ens160"} 5.79413802e+09
node_network_transmit_bytes_total{device="ens160"} 8.744797443e+09collector.os
theoretically if you have bazillion servers can be useful to watch for outdated ones
--collector.osnode_os_info{build_id="",id="ubuntu",id_like="debian",image_id="",image_version="",name="Ubuntu",pretty_name="Ubuntu 20.04.3 LTS",variant="",variant_id="",version="20.04.3 LTS (Focal Fossa)",version_codename="focal",version_id="20.04"} 1
node_os_version{id="ubuntu",id_like="debian",name="Ubuntu"} 20.04collector.pressure
can be used to watch for lack of server resources
--collector.pressure# counter Total time in seconds that processes have waited for CPU time
node_pressure_cpu_waiting_seconds_total 5063.650201
# counter Total time in seconds no process could make progress due to IO congestion
node_pressure_io_stalled_seconds_total 586.542031
# counter Total time in seconds that processes have waited due to IO congestion
node_pressure_io_waiting_seconds_total 633.69588
# counter Total time in seconds no process could make progress due to memory congestion
node_pressure_memory_stalled_seconds_total 0.08806399999999999
# counter Total time in seconds that processes have waited for memory
node_pressure_memory_waiting_seconds_total 0.589262collector.processes
from man ps
D uninterruptible sleep (usually IO) I Idle kernel thread R running or runnable (on run queue) S interruptible sleep (waiting for an event to complete) T stopped by job control signal t stopped by debugger during the tracing W paging (not valid since the 2.6.xx kernel) X dead (should never be seen) Z defunct ("zombie") process, terminated but not reaped by its parent
can be seen ps -o pid,state,command
technically can be used for spikes of processes, also for a zoombie processes
--collector.processesnode_processes_state{state="I"} 70
node_processes_state{state="R"} 1
node_processes_state{state="S"} 120
node_processes_threads_state{thread_state="I"} 70
node_processes_threads_state{thread_state="R"} 1
node_processes_threads_state{thread_state="S"} 315collector.stat
Can be used to watch for services stuck waiting for IO
--collector.statnode_procs_blocked 0collector.systemd
Can be used to monitor that required services are up and running
--collector.systemd
--collector.systemd.unit-include="(ssh|zookeeper|kafka|schema-registry|kafka-rest)\\.service"
node_systemd_unit_state{name="zookeeper.service",state="activating",type="simple"} 0
node_systemd_unit_state{name="zookeeper.service",state="active",type="simple"} 1
node_systemd_unit_state{name="zookeeper.service",state="deactivating",type="simple"} 0
node_systemd_unit_state{name="zookeeper.service",state="failed",type="simple"} 0
node_systemd_unit_state{name="zookeeper.service",state="inactive",type="simple"} 0